

Where the Fund's Factories Would Be
Article 6-1
Where the Fund’s Factories Would Be
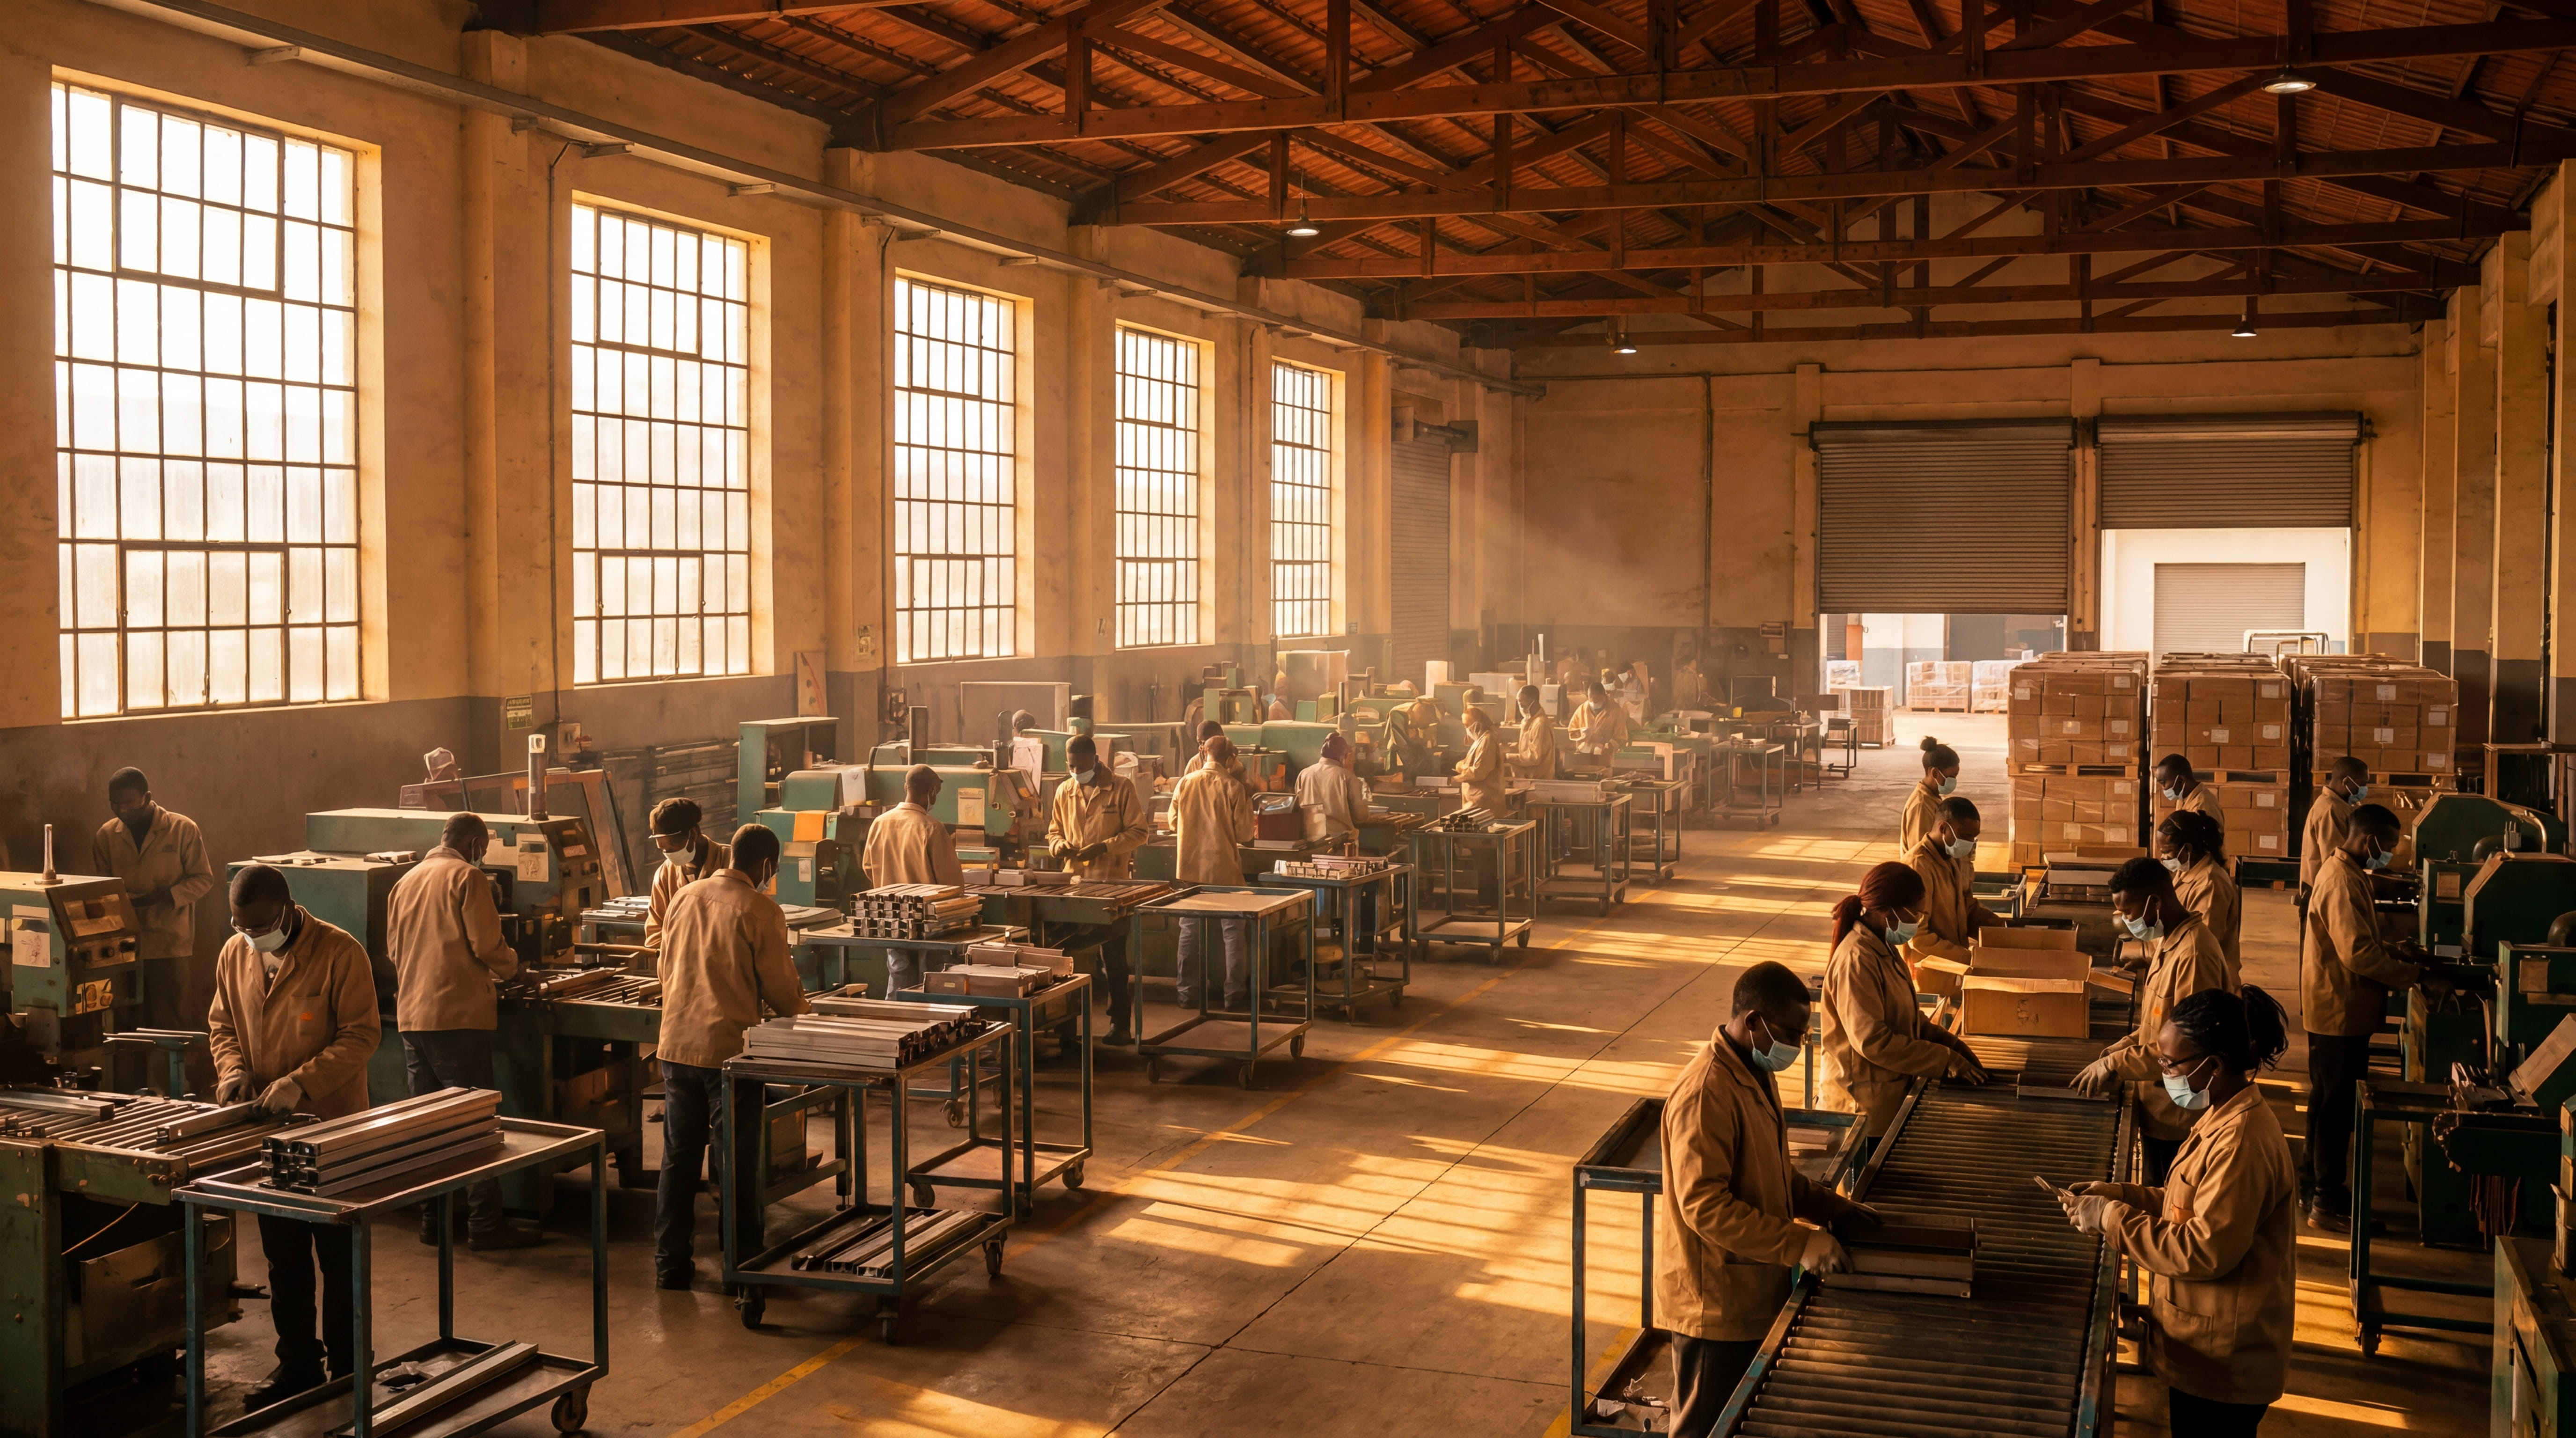
A 25-year plan to move 41 million manufacturing jobs from over concentrated countries to where they are needed most seeking job distribution fairness around the world without dismantling anyone’s economy.
This is Part 6 of the series, and its job is proof. The earlier parts argued that the fund would manufacture fairly — placing its factories where work is needed rather than only where production is cheapest, and using that placement to spread opportunity across the world rather than concentrate it. [Cross-ref: Article 3-3 — Manufacturing the World Fairly.] That is a strong claim, and a reader is right to want it backed with real numbers rather than good intentions. This part is the quantitative backbone behind it: a country-by-country model of how manufacturing could actually be redistributed, what it would cost which countries, and what it would deliver.
The question this article answers is the hard one underneath the promise. Even with a global dividend providing a floor of income, how do we make a fair distribution of the jobs that let people earn more than that floor? Today many jobs are concentrated in a few regions, which means the opportunity to earn a higher income mostly reaches those who happen to live nearby. The fund’s companies should instead be spread across many regions, in the countries where more jobs are actually needed.
With the help of Claude AI, we built a draft model for only a percentage of the total jobs worldwide. We will start with manufacturing jobs as some could be relocated with a goal in mind, every country should end with an unemployment rate between 3% and 10%. We built five scenarios, 194 countries, 30 manufacturing categories, using every plausible source we could find.
The world population is around 8.3 billion people with close to 4.5 billion able to work. Currently there are around 3.7 billion jobs worldwide. Manufacturing represents around 523 million jobs or 14.8% of that total workforce. There are other types of jobs like mining, construction, agriculture, utilities workers that cannot be relocated and they represent 35.1%. The other 50.2% comes from the services industry like wholesale and retail, transport, finance, admin, healthcare, education and hospitality, not jobs to relocate but that could be impacted by relocating manufacturing and by the $1 global fund itself.
We want to make clear that we understand there is a little more than 9% unemployment rate that includes those actively seeking for a job, those who were looking but got discouraged and stopped, and those who would like to work but are currently taking care of a relative. We are not yet proposing to diminish unemployment but, as a first step, to redistribute the unemployment rate around the world.
The proposal in one sentence (the dates are illustrative — read them as “over the first 25 years” since the fund’s launch date, here mapped to 2032–2061 for concreteness): over 25 years, redistribute 41 million manufacturing jobs from over-represented countries to under-represented ones — prioritizing countries where unemployment is higher but keeping into account that, in our conservative approach exercise, no country can absorb new jobs higher than 6% per year.
Why Move Manufacturing at All?
Manufacturing employs 523 million people worldwide. About 41% of them — 215 million workers — are in China alone. Add the next four largest producers (India, Indonesia, US, Vietnam), and you reach 62% of global manufacturing concentrated in five countries.
This concentration isn’t natural. It is the residue of three decades of supply-chain decisions optimized for one variable: cost. Whether that is good or bad depends on who you ask. A consumer buying a $30 t-shirt, benefits from concentration. A worker in Lagos or Karachi or Lima — capable of doing the same work at the same wage but without a local factory to do it in — does not benefit.
And here is what the consumer-cost framing misses: concentration is fragile.
When 77% of advanced semiconductors come from one country (China and Taiwan combined approach that share), every other country becomes dependent. When 64% of consumer electronics assembly is in one country, a single political event can reshape the global economy. We do not need countries that eventually could become imperialistic and start extorting others by concentrating some kind of power.
So, the question is not whether to redistribute. The question is how.
The Five Approaches We Tested
“Fair” means doing a lot of work in any redistribution proposal. Different definitions produce wildly different answers. We built five scenarios to make the philosophical choices visible:
Equity-leaning optimizes for allocation that matches each country’s working-age population share as closely as possible — the most aggressive of the five, moving 176M jobs.
Balanced optimizes for a fair working-age population share, adjusted for existing competitive advantages and each country’s capability to absorb new jobs. It moves 151M jobs.
Efficiency-leaning rewards existing competitive producers and minimizes disruption. It moves 129M jobs.
Unemployment-Leveling aims to bring countries with high official unemployment down to ~10%. It moves 9M jobs.
Informal Insertion helps countries that have both high official unemployment and large informal-manufacturing pools. It moves 41M jobs.
Each scenario answers a different question, and each has merits. But for an actual implementation proposal, we want one that:
-
Helps real workers (not just abstract “fair shares”)
-
Is politically achievable (doesn’t require dismantling China’s economy)
-
Is honest about what manufacturing alone can and cannot fix
The choice was Informal Insertion. What’s Informal Insertion? Here’s what it does and why.
The Proposal — Informal Insertion
The official unemployment rate is a misleading metric for places like India, Bangladesh, Nigeria, and Pakistan. India’s official unemployment is 4.5% — sounds fine. But 73% of India’s manufacturing workforce is informal: unregistered, precarious, no benefits, no contract. That is roughly 44 million Indian workers in manufacturing who would gladly take a formal job if one existed.
The Informal Insertion scenario treats this hidden distress as legitimate demand for redistribution. For each country, it computes:
Effective demand = the maximum of:
(a) Officially unemployed people above a 10% threshold, OR
(b) 25% of informal manufacturing workers (those who would accept formalization)
Then it redistributes manufacturing globally to meet that demand, subject to a critical constraint: no country can grow its total manufacturing employment by more than a conservative 6% per year. Over 25 years that compounds to a total of about 3.2 times the number of manufacturing jobs it currently has. Every successful industrialization in modern history (South Korea, Taiwan, Vietnam, Bangladesh) could at least hit this rate in their boom decades.
What gets redistributed: 41 million jobs.
| Demand source | Volume |
|---|---|
| Path 1: Official unemployment above 10% ceiling | 13.3M jobs |
| Path 2: 25% of informal manufacturing workers | 32.7M jobs |
| Effective demand (max of both per country) | 45.2M jobs |
| Absorbable after 6%/year cap | 40.6M jobs |
Where they go.
| Region | 2036 mfg jobs | 2061 mfg jobs | Change |
|---|---|---|---|
| South Asia | 70M | 83M | +13M (+18%) |
| Sub-Saharan Africa | 31M | 39M | +8M (+27%) |
| MENA + Pakistan/Afghanistan | 28M | 33M | +5M (+17%) |
| Latin America & Caribbean | 36M | 39M | +3M (+9%) |
| Europe & Central Asia | 62M | 62M | ~flat |
| North America | 17M | 15M | -2M (-15%) |
| East Asia & Pacific | 280M | 253M | -27M (-10%) |
Possible Solutions for the Job Donors
It might sound scary for a country to be told that their manufacturing jobs will be reduced so another country with a greater need can absorb them by relocating factories. However, remember that our proposal is only for the global fund to move its own factories, and the global fund is owned by its investors who would hopefully be the entire global population. If people have a stronger local economy, cheaper products and increasingly higher dividends just by the fund’s existence and strategy, then their basic needs could be met so no person anywhere is in extreme poverty.
Another revenue stream would be royalties: the fund pays inventors and innovators a share of profits when their ideas are commercialized through fund-owned companies. This rewards people for contributing new products and processes to the fund’s global productive system, complementing the universal dividend with a merit-based payment for innovation (see Article 3-5 — The Fund and the Entrepreneur and Article 2-1 — The 99% of Humanity Global Fund for details).
A government would redirect its social efforts by encouraging innovation or allowing dividing the day shift so some people can work half of the time and allowing some others to work the other half. The off time promotes more family and leisure time or time to be used in creative ideas that can bring royalties.
Half-shifts (work-sharing). The German “Kurzarbeit” model: convert some full-time positions into two-person half-shifts. Two workers each willing to work half the hours, with the income gap covered by other revenue streams like royalties, entrepreneurship or the dividends from the global fund. This doubles the employed headcount in those positions. People work less but more people work.
This wasn’t modeled in this analysis — we want to analyze that option in a future post — but for cap-bound countries, work-sharing in manufacturing could plausibly close another 3–5 percentage points of unemployment without violating any structural constraints.
The Two Countries Everyone Wants to Ask About
China goes from 215M manufacturing workers at baseline (2036) to 186M in 2061. That’s a 14% reduction over the 25-year relocation — about 0.5% per year, slower than China’s working-age population is shrinking due to aging. In real terms: this isn’t a contraction so much as natural attrition.
India goes from 60M to 70M, a 17% gain — 10 million additional formal manufacturing jobs over the 25-year relocation. But the more important number isn’t the total. It’s that 33 million Indian workers transition from informal to formal employment: same factories, same work, but now with contracts, benefits, and stable wages.
The Headline Finding Most People Will Miss
The biggest welfare gain isn’t the 41M redistributed jobs. It’s the 33 million workers globally who move from informal manufacturing to formal manufacturing. They don’t show up in unemployment statistics — they were already “employed.” But their lives change anyway: stable income, social protections, the ability to plan for the future. Globally, informal manufacturing drops from 131M to 98M workers — a 25% reduction in informal-sector pressure.
Regional Sourcing — Closer to Home, Not Cheaper
So far, the model has answered where jobs should be, but not who buys what from whom. That matters because the world’s current supply chains optimize for one thing: the absolute cheapest production location, anywhere on the planet. A USA consumer’s t-shirt comes from Bangladesh; their phone is assembled in China; their car parts crisscross the Pacific multiple times before reaching the assembly line.
That arrangement produces cheap consumer goods but also produces the fragility we’ve seen exposed during recent global disruptions. A more resilient model is regional sourcing: countries within a sub-region producing for each other rather than for the entire world.
We tested this by adding a regional optimization layer to the redistribution. The 194 countries are grouped into 10 sub-regions (Greater North America, South America, Western Europe, Southern Europe, Nordics, Eurasia, South Asia + Middle East + North Africa, West & Central Africa, East & Southern Africa, and East Asia + SE Asia + Oceania). Within each sub-region, the model favors sectoral specializations where each country produces something its neighbors need — so trade flows regionally rather than globally.
This produced a real but uncomfortable finding worth being honest about.
The honest finding: strict anti-extortion caps cannot be enforced under conservative redistribution. An anti-extortion principle says: no single country in any sub-region should control more than 40% of any manufacturing category. Why? Because if one country controls more than that, it can use its dominance as a political weapon — withholding supply during disputes, demanding favorable terms, leveraging dependence into coercion.
We tried to enforce this. It didn’t work. Under Informal Insertion (the conservative proposal that preserves most of China’s manufacturing), China remains 73% of East Asia + SE Asia + Oceania’s total manufacturing. No mathematical arrangement of sectors within that sub-region can satisfy the 40% cap when one country accounts for 73% of regional production overall.
The strictest enforceable caps under the redistribution are:
-
Balanced scenario: 65% cap (still permissive but enforceable)
-
Informal Insertion scenario: 75% cap (very permissive)
This is itself an argument. The moderate Informal Insertion proposal does enormous good for workers but leaves the structural conditions of economic coercion intact. If you genuinely want to prevent any country from holding others hostage through manufacturing dominance, you need more aggressive redistribution than Informal Insertion provides. The Balanced scenario is closer to what full anti-extortion would require.
We are not abandoning Informal Insertion. We are being honest that it solves the worker-welfare problem (which is enormous) but doesn’t solve the political-coercion problem. Those are different problems with different solutions.
A separate question: would regional sourcing make goods more expensive? A reader might ask: if the USA sources t-shirts from Mexico instead of Bangladesh, doesn’t that raise costs for American consumers? In the short term, yes — Mexican production costs more than Bangladeshi production today. The proposal accepts this trade-off because regional supply chains are less politically fragile and create employment closer to where consumers actually live.
But this isn’t a decision to make overnight, and it isn’t a decision to make once for everything. Each industry, each product, each supply chain needs its own analysis. Some products (basic textiles, simple electronics assembly) might justify continued long-distance sourcing for years; others (vehicles, food processing, construction materials) benefit immediately from regional production. The fund’s shareholders should be voting on these trade-offs industry by industry, with the regionalization happening gradually as wages and infrastructure converge across regions.
The full pricing and value-chain analysis will appear in a future post in this series. For now, the principle is: regional sourcing is the direction, the pace is negotiable, and the analysis must be done in detail for each sector.
The Implementation Timeline
Five years of relocation planning (beginning at The Launch), then five five-year tranches (the calendar years below are illustrative, anchored to the 2032 Launch for concreteness). Most diffuse industries first; most concentrated last.
| Period | What happens |
|---|---|
| 2027–2031 | Global Fund planning phase and consolidation. |
| 2032–2036 | Hiring experts from each country worldwide. Relocation planning phase. International citizens agreements, training infrastructure, transition support funds, baseline data agreements. |
| 2037–2041 (Tranche 1) | Cargo vehicles, ores, processed food, wood products, furniture, jewelry. (Most diffuse industries — easiest to redistribute.) |
| 2042–2046 (Tranche 2) | Paper, hybrid vehicles, textiles, specialty chemicals, energy products, aerospace. |
| 2047–2051 (Tranche 3) | Misc. manufactures, tobacco/feed, base metals, plastics & basic chemicals, aluminum, vehicle parts. |
| 2052–2056 (Tranche 4) | Steel, combustion vehicles, cement, footwear, solar/wind, pharmaceuticals. |
| 2057–2061 (Tranche 5) | Optical/medical, industrial machinery, batteries, consumer electronics, EVs, semiconductors. (Most concentrated — needs the longest runway.) |
Why this order? The most concentrated industries (semiconductors, EVs) require the longest training pipelines and the most expensive infrastructure. Putting them last gives receiving countries 25 years to develop the engineering workforces they’ll need by Tranche 5.
Now Compare to What Full Fairness Would Require
Informal Insertion is the moderate proposal. It’s the one we think can be negotiated but we still want to show the contrast with full fairness (Balanced Scenario).
If you look at the philosophical equity argument seriously — every country’s manufacturing share should match its working-age population share, weighted by capability — you’d get the Balanced scenario, and the numbers look very different:
| Country | Baseline jobs (2036) | Informal Insertion (2061) | Balanced (2061) |
|---|---|---|---|
| China | 215M | 186M | 72M |
| India | 60M | 70M | 108M |
| USA | 16M | 13M | 30M |
| Vietnam | 12M | 13M | 8M |
| Bangladesh | 8M | 10M | 8M |
| Brazil | 12M | 13M | 16M |
| Pakistan | 11M | 14M | 14M |
| South Africa | 2M | 5M | 5M |
Under the Balanced Scenario, China’s manufacturing employment would drop from 215M to 72M — a 67% reduction. That’s not zero — it’s the level of mid-sized industrial economies — but it would represent a profound restructuring of China’s labor market. Politically, it would require something comparable to a consensual disarmament — a degree of voluntary structural rebalancing rarely seen historically.
The contraction in China’s last tranche (2057–2061) would hit -10.2% per year. That would be a level of churn historically associated with crises, not policy.
We are not endorsing Balanced as the proposal. We are showing it because readers should see the gap between “what’s politically tractable” and “what fairness would actually require.” Closing that gap is the work of decades, perhaps centuries. But seeing the gap is the first step to reasoning about it honestly.
The Limits of What Manufacturing Alone Can Do
Even under Informal Insertion, 17 countries remain above 10% unemployment in 2061. They are “cap-bound” — meaning even if they grew their manufacturing as fast as the model allows, their populations would still face severe joblessness.
The cap-bound countries are:
-
Sub-Saharan Africa: Eswatini, South Africa, Botswana, Gabon, Namibia, Lesotho, Malawi, South Sudan
-
MENA + Conflict-Affected: Djibouti, Palestine, Iraq, Jordan, Yemen, Syria, Libya, Tunisia, Morocco
-
Other: Haiti, Albania, Ukraine
For these countries, manufacturing redistribution is necessary but not sufficient. Two complementary strategies need to be considered: Half-Shifts, which we already covered, and the Service-Sector redistribution.
Service-Sector Redistribution
Manufacturing is only ~15% of global employment. Services are the bigger lever. Some services (industry-specific consulting, international/maritime law, media production, software services) can be redistributed — they just weren’t in scope for this model. A future analysis would extend the framework to relocatable services.
Other services — haircuts, mechanics, agriculture, retail, healthcare delivery, schools — are inherently local. They’ll grow naturally in any country whose population grows, regardless of redistribution policy. As more people get employed, become entrepreneurs with the Help of the fund’s banking services, or earn royalties, more demand for local services would increase, thus, demanding more jobs in the services industry. A robust global fund dividends plus a strong manufacturing base creates the extra demand that pulls these expanded local services into existence.
Important Limitations and What Could Go Wrong
This is a methodology, not a fixed plan. Labor market conditions will change over 25 years. Demographics will shift. Technologies will emerge. The numbers in this post should be recalculated every 5 years (between tranches) using updated data. The framework matters more than any specific number.
Things this model gets approximately right:
-
Current manufacturing employment by country and by sector (sourced from ILO, INDSTAT, UN Comtrade, WPP)
-
Informal employment patterns (sourced from ILO informal economy data)
-
Capability scoring based on governance, education, and existing industrial base (WGI, UIS, World Bank)
-
Historical industrialization rates (calibrated against South Korea 1965-85, China 1980-2010, Vietnam 2000-20, Bangladesh garments 1980-2010)
Things this model gets approximately wrong (and you should know):
-
Demographic projections to 2061 are uncertain. We used WPP 2024 Medium Variant projections. By 2050, fertility surprises could shift labor force projections by 10-20% in either direction.
-
The 25% informal-formalization assumption is a guess. It might be 15% or 35%. The methodology is robust to any percentage, the specific magnitudes shift and polls should be conducted.
-
Sectoral capability scores are imperfect. A country’s “capability” to do semiconductor manufacturing in 2036 isn’t the same as in 2061. The model assumes capability is roughly persistent over 25 years, which isn’t quite right but probably isn’t wildly wrong either.
-
The model assumes redistribution can be coordinated globally. Whether such coordination is politically achievable is a separate question. The model says if you could coordinate it, here’s what it would look like.
-
Half-shifts and broader service redistribution are mentioned but not modeled. Future work.
What no model can capture. Whether moving 41 million manufacturing jobs is a good idea isn’t a question models answer. Whether it’s possible — what trade-offs come with it, who bears the costs, how long the transition takes — those are questions where models help. The numbers in this post are a starting point for people around the world to think about it and debate, not a substitute for it.
Why This Matters Even If You Don’t Agree
The default for global manufacturing distribution isn’t a policy. It’s the residue of millions of corporate decisions, none of them voted on, none of them accountable to the workers affected. The current concentration is itself a political outcome — just one that happened by accumulation rather than by design.
You can disagree with this proposal and still recognize that some redistribution framework needs to exist. The alternative is to leave as is the future of global labor markets and to the same forces that produced the current concentration: cost optimization by multinational corporations, with side effects carried by workers everywhere.
If the global investment fund is the floor, this job redistribution is what shapes the rest of the building. Meaningful work — work that pays well, has dignity, and exists in the place where people live — is what makes lives worth living; and it gives extra income to those with higher economical expectations.
The point of this exercise isn’t to predict 2061. It’s to demonstrate that fair redistribution is possible, calibrated to historical industrialization rates, and that the moderate version of it (Informal Insertion) achieves enormous welfare gains without political impossibility. If 41 million workers can move from informal to formal manufacturing employment over 25 years, that’s a real change to real lives. Even if the timing is off, even if the categories shift, even if some countries opt out — the methodology stands.
This Is Part of Something Larger
The manufacturing redistribution described in this post isn’t a standalone proposal. It’s one piece of a larger system that’s being developed across this series.
The $1 global fund is the financial backbone: every person on Earth, from birth, participates in a fund that contributes $1/month and influences industries, strengthens local economies and pays back dividends from its accumulated ownership of global productive capacity. Manufacturing redistribution (this part) is how the fund makes sure the jobs that produce that global fund dividends exist where people actually live, not just where production happens to be cheapest.
The complete analysis (194 countries × 30 categories × 5 scenarios) is available as downloadable data and a full methodology. See Article 6-2 — The Redistribution Methodology, Article 6-3 — Five-Scenario Comparison Data, and Article 6-4 — Phased Implementation Data. Sources include UN WPP, ILO ILOSTAT, UN Comtrade, UNIDO INDSTAT, World Bank WGI/LPI, USGS, Energy Institute, and UNESCO UIS, all consulted as of May 2026.
About this series: The 99% of Humanity Global Fund Series proposes a global investment fund every human participates in from birth — citizen-owned, democratically governed, and structured to gradually replace extractive global capitalism with mission-driven citizen-owned production within capitalism. This post addresses where the fund’s owned companies’ jobs should be.
Next: the full methodology behind these numbers — the five scenarios, the absorption caps, the regional optimization layer, and an honest accounting of what the model gets right and wrong.
Join the conversation
This series belongs to everyone, including its critics. Tell us where you were convinced and where you were not — and if you see a way to make the proposal stronger, say so. You'll need a free account with a handle of your choosing.
Reset your password
Enter the email you signed up with. If it's registered, we'll send you a link to set a new password.
Be the first to comment.